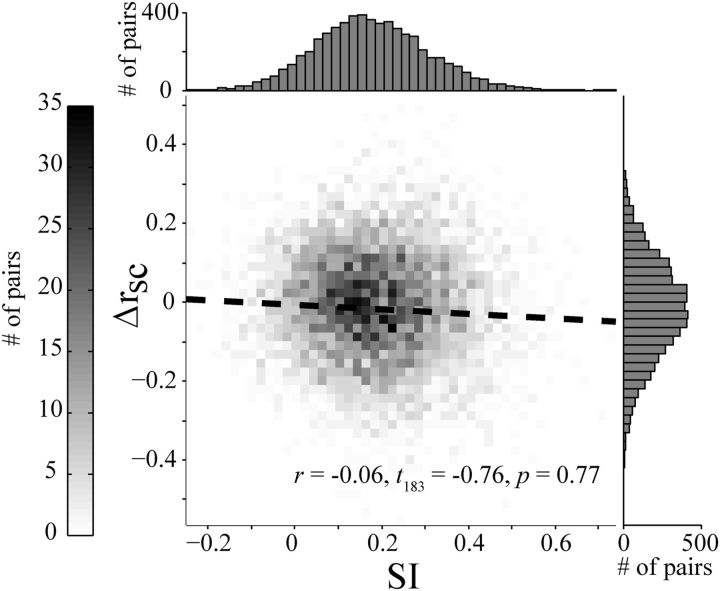
Figure 4.
Relationship between surround-suppression index (SSI) and rsc modulation (Δrsc). The dashed line indicates the best linear fit (in a least-squares sense). Top and right, Depict the marginal histograms for the SSI and Δrsc distributions, respectively. Note that the drop in correlation here is less than that for the full dataset, but is significant (p ≪ 0.001).

