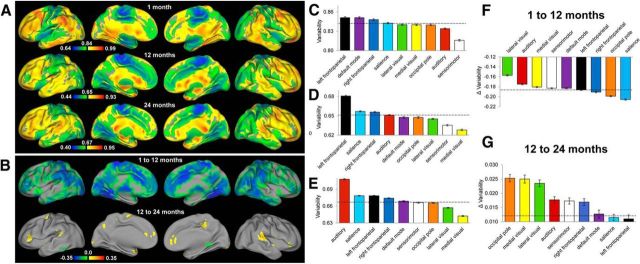
Figure 1.
Intersubject variability pattern of the brain's functional connectivity during infancy (singletons). A, Intersubject variability map of the brain's functional connectivity in neonates (top row), 1-year-olds (middle row), and 2-year-olds (bottom row); values were demeaned (the mean values are labeled at the middle of the color bars): cool colors represent values below the whole-brain mean intersubject variability and warm colors represent values greater than the mean. B, Areas showing statistically significant changes (p < 0.05 after cluster-size multiple-comparisons correction) in intersubject variability of the brain's functional connectivity during the first year (top row) and second year of life (bottom row). C, Network-level intersubject variability of the brain's functional connectivity at 1 month measured based on singleton subjects. D, Network-level intersubject variability of the brain's functional connectivity at 12 months measured based on singleton subjects. E, Network-level intersubject variability of the brain's functional connectivity at 24 months measured based on singleton subjects. F, Developmental changes in network-level intersubject variability during the first year of life. G, Developmental changes in network-level intersubject variability during the second year of life. Dashed lines for C–G correspond with the mean (C–E)/mean changes (F, G) of intersubject variability of all voxels in the brain. Error bars represent SEM of voxels within network masks.

