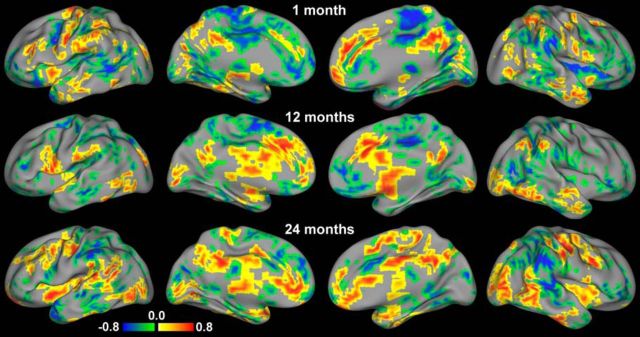
Figure 5.
Relationship between the intersubject variability of and genetic effects on the brain's functional connectivity. Areas with statistically significant (p < 0.05 after multiple-comparison correction) positive (red) and negative (blue) correlations between intersubject variability and genetic effects are visualized for the three age groups.

