
Figure 1.
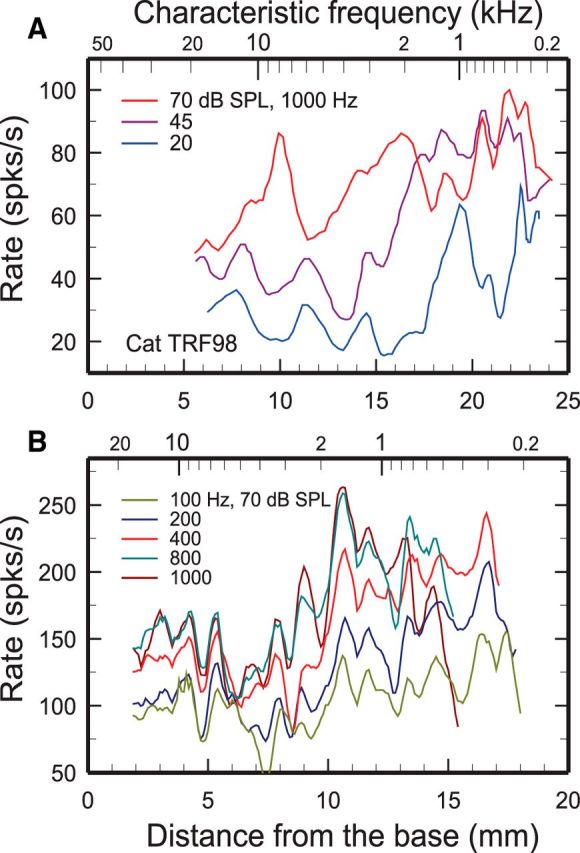
Spatial profiles of ANF rates of response to low-frequency tones in cat and chinchilla. A, Running averages of rates of response to 1 s, 1 kHz tones of 119 ANFs with SRs >15/s in one cat (legend indicates levels). The upper and lower abscissa scales, respectively, indicate CFs and the corresponding distances derived from a cochlear map for cats (Liberman, 1982; data from Kim and Molnar, 1979, their Figs. 5A, 4A, 3A, cat TRF98). B, Average rates of responses to 5 100 ms tones presented at 70 dB SPL (legend indicates frequencies) in 227–311 ANFs with SRs >18/s pooled across 33–36 chinchillas (Temchin and Ruggero, 2010). Trends were extracted from individual raw data by computing average rates within 0.1 mm bands and low-pass filtered (corner frequency, 2 mm−1; see Materials and Methods). The upper and lower abscissa scales, respectively, indicate CFs and the corresponding distances, derived from a cochlear map for chinchillas (Müller et al., 2010).