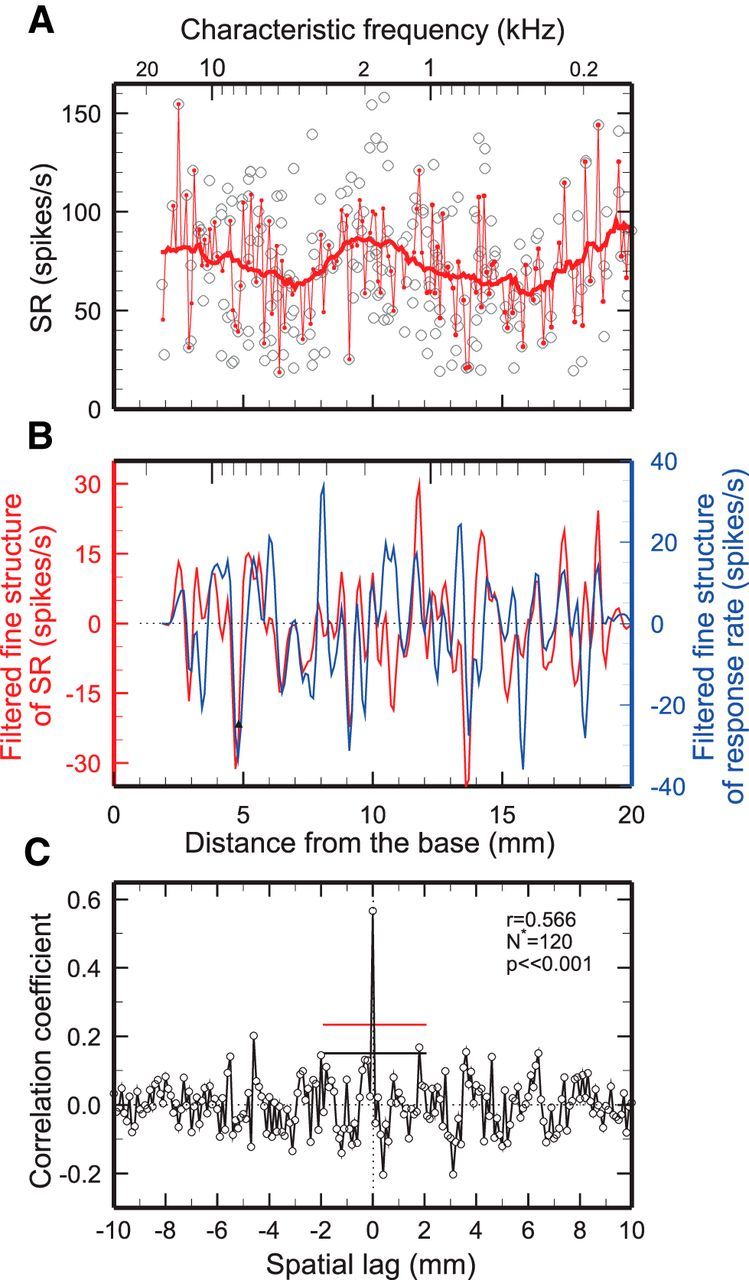
Figure 2.

Similarity of spatial irregularities of SR and rate of responses to tones in chinchilla. A, Open symbols indicate SRs of 285 ANFs with SRs >18 spikes/s pooled from 35 chinchillas, plotted against cochlear distance. Thick and thin red traces are running averages computed respectively over 2.5 or 0.1 mm bands. B, Red trace, Spatial irregularity of SRs, computed as the difference between the thin and thick traces of A and low-pass filtered (corner frequency, 2 mm−1). Blue trace, Spatial irregularity of responses to tones (100 Hz, 70 dB SPL) for the same ANFs represented in A and B (Temchin et al., 2012) computed and filtered in the same manner as for SR. C, Crosscorrelogram between the unfiltered spatial irregularities of SR and response rate. At zero lag, r = 0.566, p ≪ 0.001, N* = 120. Flat red and black lines indicate the zero-lag 99% confidence limits computed, respectively, on the assumption that correlation coefficients are normally distributed and by bootstrap resampling (see Materials and Methods).
