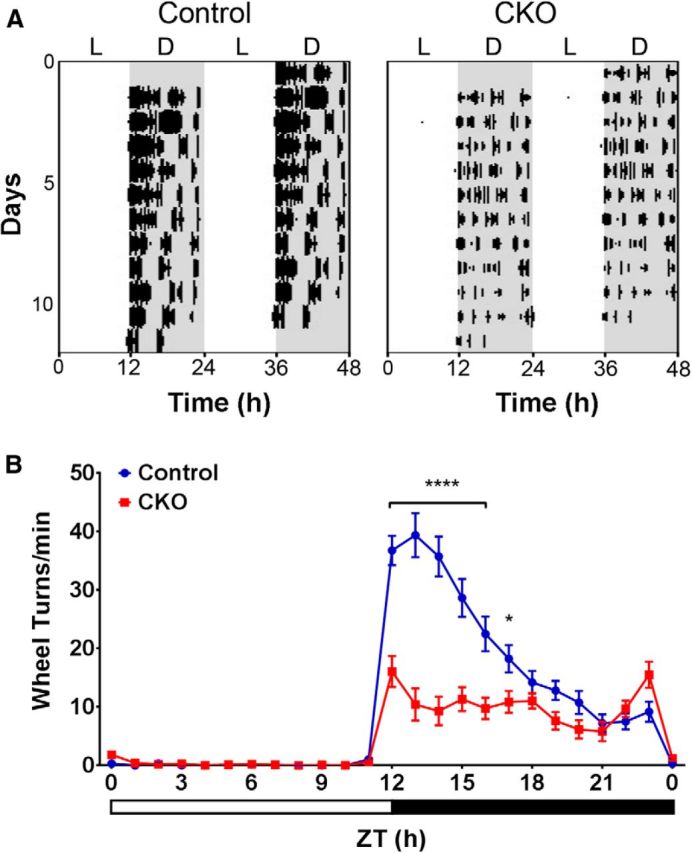
Figure 3.

WRA of dMHbCKO mice. Voluntary WRA was measured under a 12:12 LD cycle. A, WRA in representative control and dMHbCKO mice. WRA is displayed as double-plotted actograms with wheel turns as black bars on the vertical axis plotted against the 48 h period. White and gray areas represent time of lights-on and darkness, respectively. B, Summary of WRA for control and dMHbCKO mice over a 24 h day. dMHbCKO mice showed significantly less WRA throughout the day, especially during the first of the night (n = 11 and n = 14 for control and dMHbCKO mice, respectively). Eleven days of WRA were averaged for each of the control and dMHbCKO mice, with the exception for one control mouse where 7 d of averaged WRA was used. Zeitgeber time 12 (ZT12) corresponds to time of lights-off for a 12:12 LD cycle, and white and black bars below represent time of lights-on and darkness, respectively. Values for ZT0 are replotted at the end for easier visualization. N = 11 control and N = 14 dMHbCKO mice. ****p < 0.0001 (ZT12 to 16), significant difference between genotypes. *p = 0.024 (ZT17), significant difference between genotypes.
