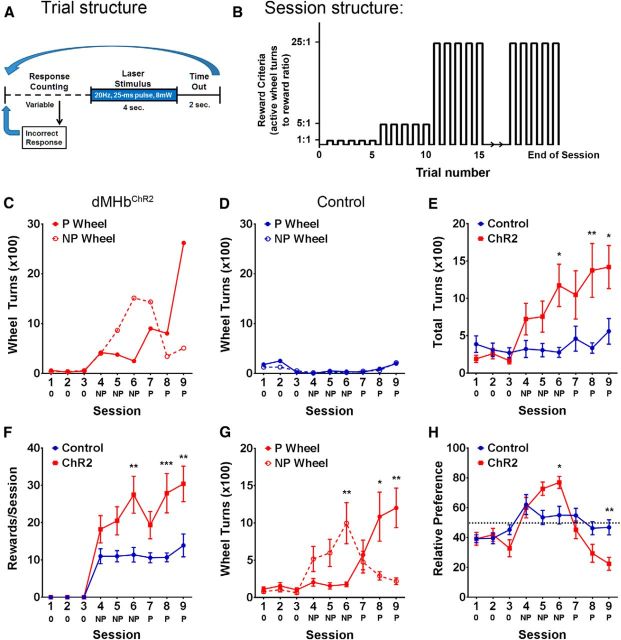
Figure 7.
Optogenetic activation of dMHb neurons in vivo mediates primary reinforcement. A, Structure of the ICSS trials. Each ¼ turn of the active response wheel is scored as an event. When the reward condition is met, a 4 s train of 25 ms light pulses is delivered at a frequency of 20 Hz, followed by a 2 s time out during which events do not count toward a reward. Turns of the inactive wheel reset the event counter. B, Stepped fixed-ratio reinforcement structure of the ICSS sessions. Each 45 min session is initiated at a fixed event:reinforcement ratio of 1:1 until five rewards have been earned, then 5:1 until 10 total rewards have been earned, then 25:1 thereafter. C, Response data for a representative dMHbChR2 mouse across nine sessions; three sessions without laser stimulation (0), three sessions with laser stimulation evoked by turning the initially nonpreferred wheel (NP), and three crossover sessions of stimulation of the initially preferred wheel (P). D, Response data for a representative control mouse. E, Summary of total wheel turns per session (sum of both wheels) for cohorts of dMHbChR2 and control mice. A trend toward increased wheel turning by dMHbChR2 mice relative to controls is observed on the first stimulated session (session 4) and is significant by session 6. **p < 0.01, significant difference between genotypes. *p < 0.05, significant difference between genotypes. F, Average number of rewards (light pulse trains) earned per session by dMHbChR2 and control mice. A dip is observed in the rewards earned on session 7 because of a large number of incorrect responses following the crossover of the rewarded side. The plateau observed in the control mice at ∼10 rewards is due in part to the stepped FR schedule, in which additional effort is required for the 11th and subsequent rewards. ***p < 0.001, significant difference between genotypes. **p < 0.01, significant difference between genotypes. G, Within-subjects comparison for mean wheel turns on the stimulated wheel (NP during sessions 4–6 and P during sessions 7–9) and nonstimulated wheel (P during sessions 4–6 and NP during sessions 7–9) across the 6 stimulated sessions. The baseline sessions are not included in the analysis because no light stimulation was administered. During the first three stimulations on the NP wheel, a trend was observed toward greater turning of the reward-associated wheel in sessions 4 and 5, which became significant by session 6. In the crossover sessions (sessions 7–9), mice rapidly shifted their response to the P wheel. **p < 0.01, significant difference between stimulation conditions. *p < 0.05, significant difference between stimulation conditions. H, Relative preference for the NP wheel across nine trials, expressed as NP wheel turns/total wheel turns × 100. The dashed line indicates 50% or no preference. dMHbChR2 mice showed positive preference for NP wheel when it was the reward-associated wheel (>50%) and negative preference (<50%) for NP when it was inactive. Preference differences from control mice were significant by the last session with each reward-associated wheel (sessions 6 and 9). **p < 0.01, significant difference between genotypes. *p < 0.05, significant difference between genotypes. N = 10 control mice and N = 12 dMHbChR2 mice.

