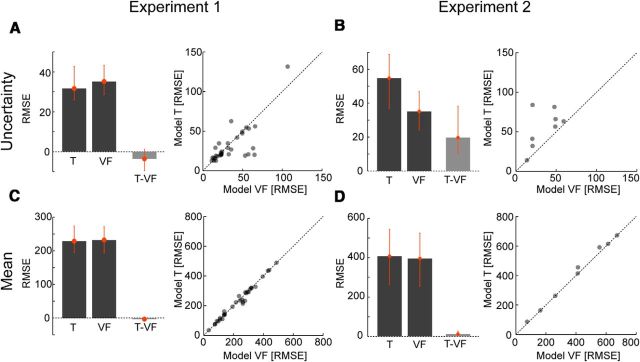
Figure 7.
Model comparison. A–D, Model comparison for Models T and VF for Uncertainty (A, B) and for Mean (C, D). Left, Weighted RMSE across subjects (95% confidence intervals, bootstrap) of each model and of the difference between models for each subject. Right, Scatterplot of the RMSE for each subject for Models T and VF.

