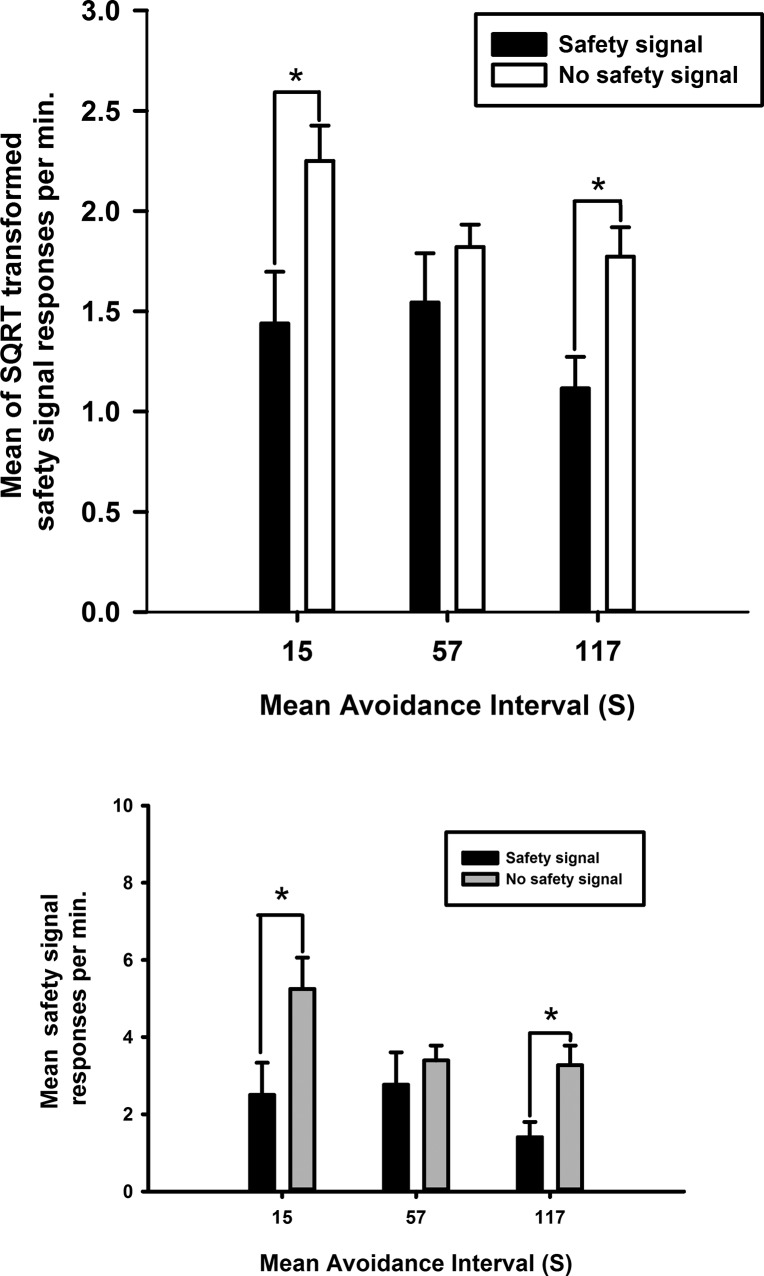
Figure 3.
Loss of inhibition of responding in the absence of the safety signal. (Top) Mean of the square root transformed rate of safety signal responding, with the safety signal versus without the safety signal following training with three different avoidance intervals, VI 15s, VI 57s, and VI 117s. (*) P < 0.05 for responding with the safety signal versus without the safety signal. Each bar represents the mean of the SQRT transformed rate of avoidance responses per minute ± SEM. (Bottom) Mean untransformed safety signal responses per minute ± SEM.

