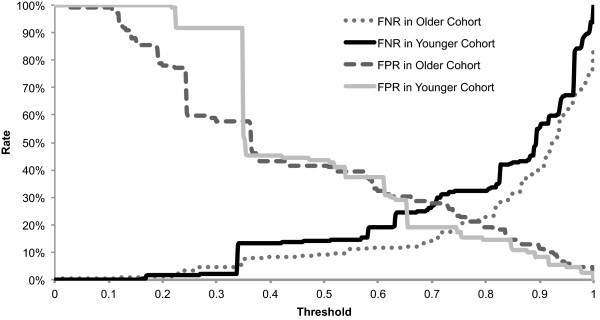
Figure 3.

Misclassification rates of models for older versus younger group at all possible thresholds. False negative rate (FNR) and false positive rate (FPR) for two of the age-based models: the older group (dashed lines) and the younger group (solid lines), are graphed for all threshold levels.
