
Figure 8.
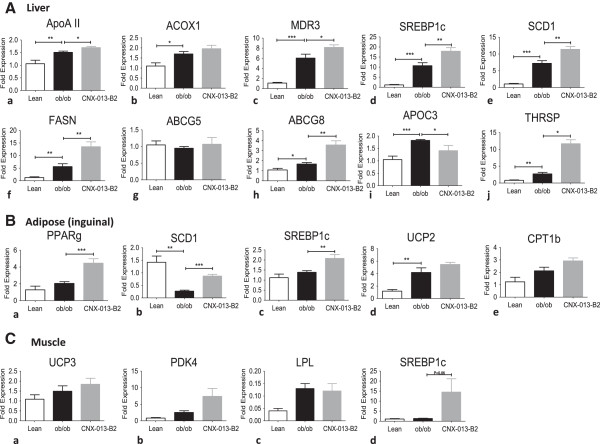
Gene expression in ob/ob mice after 4 weeks of treatment with CNX-013-B2. mRNA expression levels of multiple genes from (A) Liver, ( B ) Adipose and (C) Muscle were analyzed at the end of the study as mentioned in Materials and methods. All the values are expressed as Mean ± SEM. Statistical comparison between control and treatment group was conducted by unpaired Student’s t test. P value significance was represented as (*) <0.05, (**) <0.01 and (***) <0.001.