Figure 7.

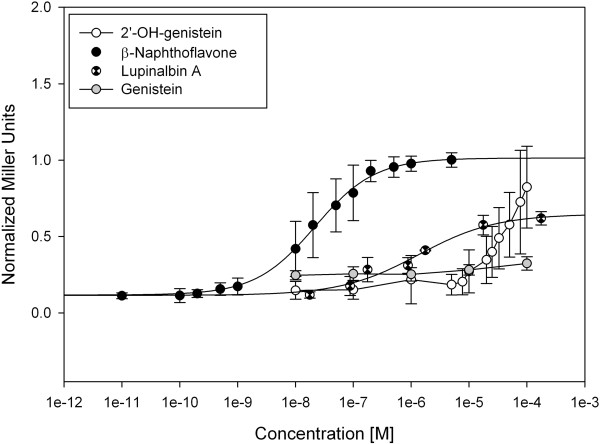
Dose-response curves of 2′-hydroxygenistein, lupinalbin A and genistein in the aryl hydrocarbon receptor yeast assay. Mean values of at least three independent experiments performed in duplicates are shown with standard deviations.

Dose-response curves of 2′-hydroxygenistein, lupinalbin A and genistein in the aryl hydrocarbon receptor yeast assay. Mean values of at least three independent experiments performed in duplicates are shown with standard deviations.