
Figure 4.
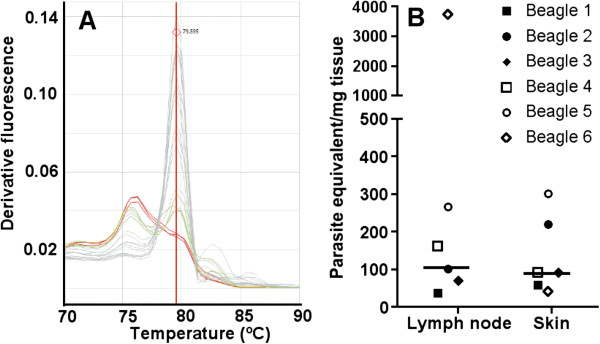
Quantification of parasite burden by qPCR. (A) High resolution melting curve of qPCR products showing the specificity of the positive amplification products (gray lines) compared to uninfected negative controls (red curves). (B) Parasite burden in the lymph nodes and skin healed lesions at 15 weeks post-infection.