Figure 4.

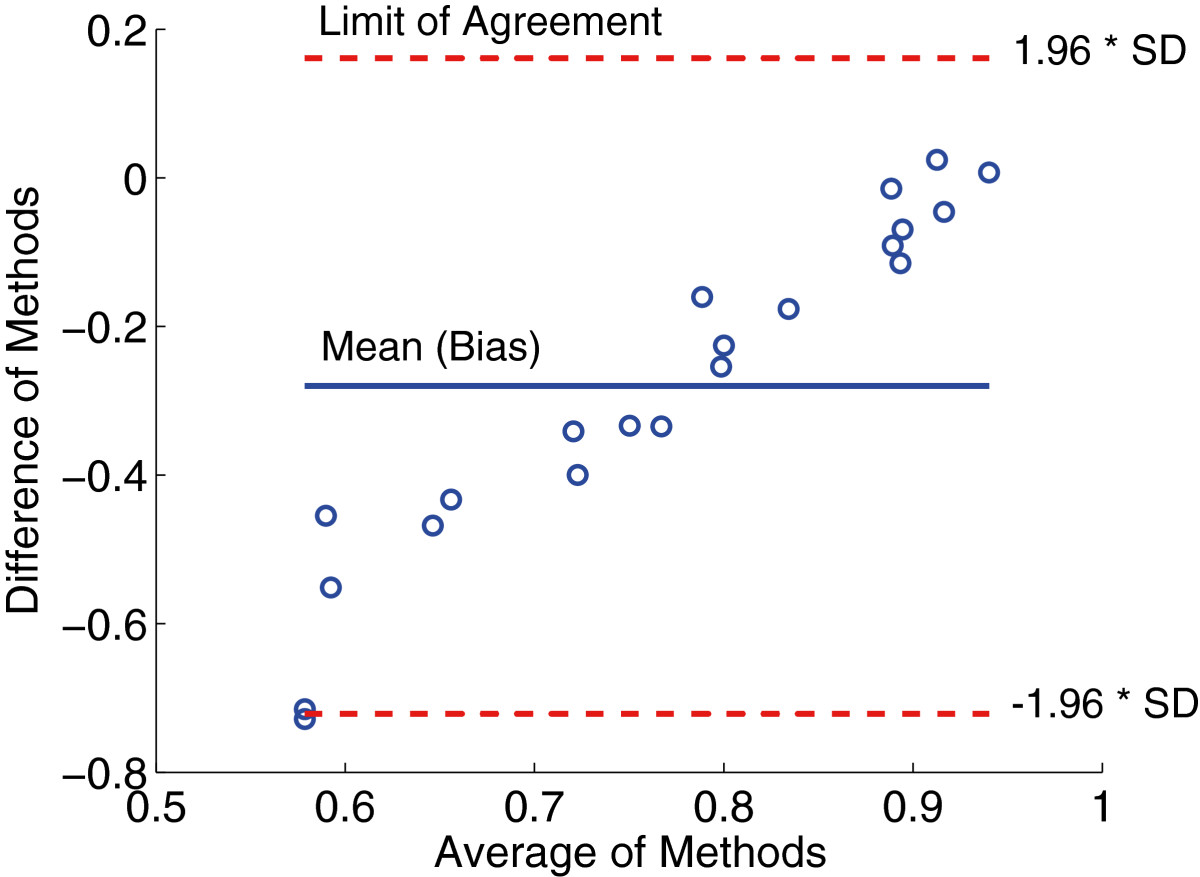
Bland-Altman plot between the ODI and the MediSens MAE scores. The x-axis represents the average value of the two scores and the y-axis represents the difference of the two scores.

Bland-Altman plot between the ODI and the MediSens MAE scores. The x-axis represents the average value of the two scores and the y-axis represents the difference of the two scores.