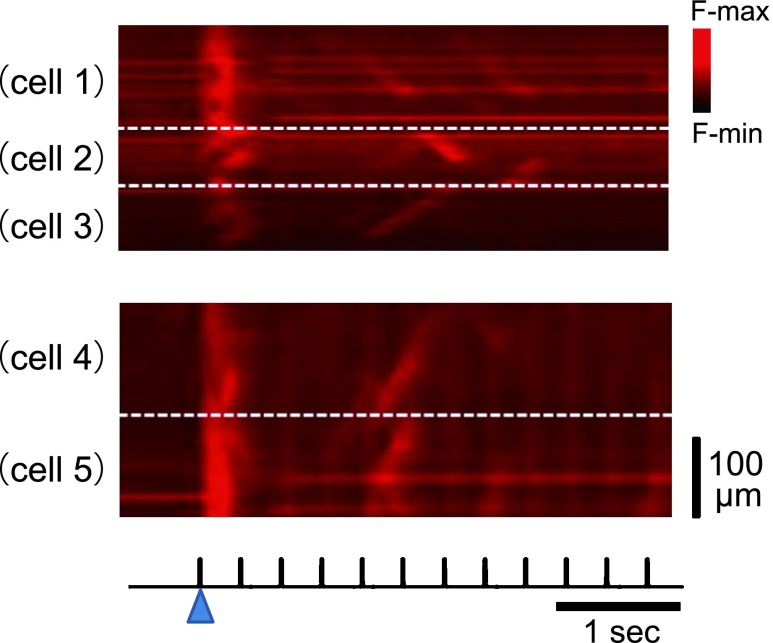
Fig. 5. .
Sequential changes in the pacing-evoked Ca2+ transients after quiescence. Two representative X-t images of the left atrial myocytes. Each X-t image obtained from the region consisted of 2–3 cells as delineated by broken lines. Electrical stimuli are shown on the bottom. The blue arrowhead denotes the time point of the initial pacing.

