
Fig. 1.
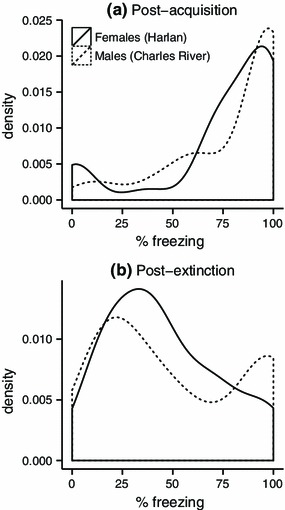
Probability density plots of the distributions of median freezing scores from the first 3 trials of the extinction session (a “Post-acquisition freezing”) and from the 3 probe trials conducted 24 h later (b “Post-extinction freezing”). Separate distributions are shown for 50 males obtained from Charles River and 50 females obtained from Harlan