
Fig. 3.
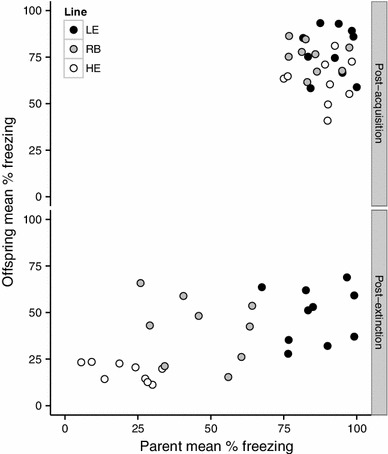
Scatter plots of offspring conditioned freezing as a function of their parents’ conditioned freezing 24 h post-acquisition and 24 h post-extinction. Each point represents a single family with the parent mean plotted on the X axis and the offspring mean plotted on the Y axis