
Fig. 5.
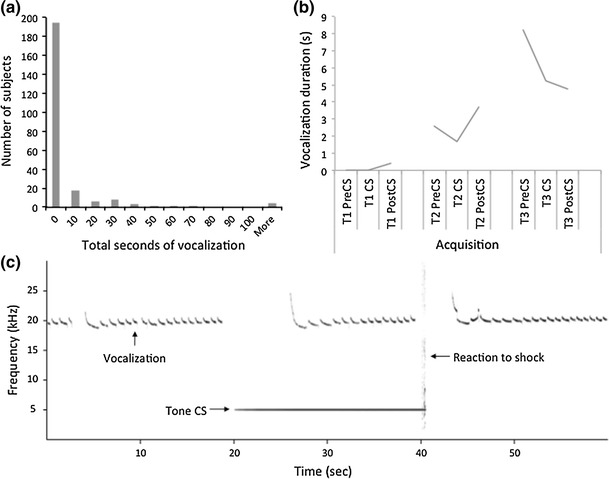
a Histogram showing frequency of 18–32 kHz “negative affect” vocalizations. b Mean 18–32 kHz vocalizations of the vocalizer sample (excluding non-vocalizers) as a function of training. Each trial (T1, T2, T3) is subdivided into three 20-s intervals before, during, and after the tone CS (Pre-CS, CS, and Post-CS). c Spectrogram from a single vocalizing subject for a single acquisition trial showing vocalizations at approximately 20 kHz, the 5 kHz tone CS, and the animal’s reaction to the shock US, which appears as a vertical line of broad-spectrum energy at the end of the tone