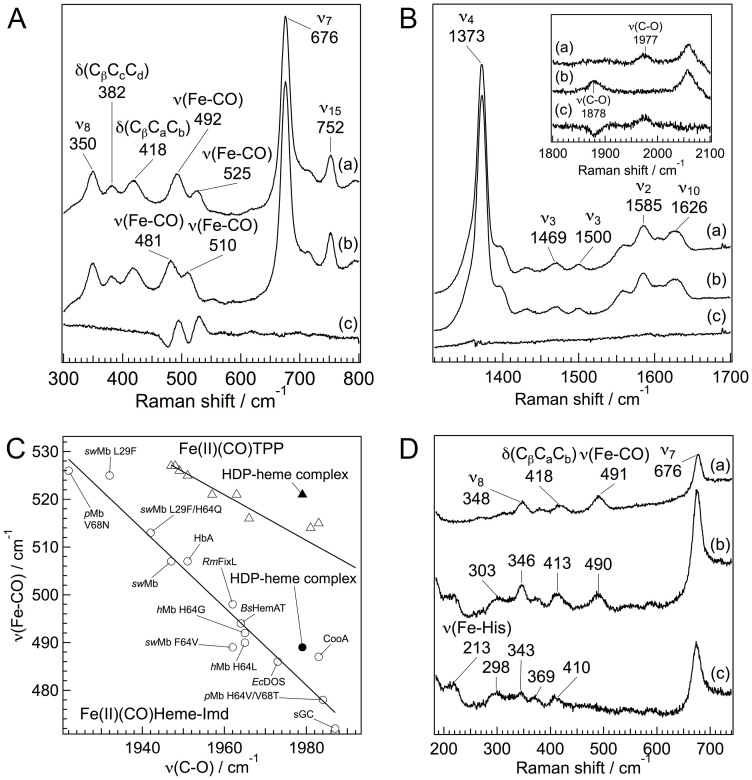
Figure 2. Heme coordination structure of the CO adduct of the HDP–heme complex.
Resonance Raman spectra of the CO adduct of the HDP–heme complex in pH 5.6. (A and B) Resonance Raman spectra of the HDP–heme complex treated with 12C16O (trace a), 13C18O (trace b), and difference spectra (12C16O–13C18O) for the low-frequency region (A) and the high frequency region (B). The excitation wavelength was set at 410 nm. (C) Backbonding correlation plot of ν(Fe–CO) versus ν(C–O) for various histidine ligated proteins and synthetic tetraphenylporphyrin (TPP) derivatives. The black circle and triangle represent the CO adducts of the HDP–heme complex. Open circles signify proteins whose axial ligand is histidine. Open triangles are TPP that has no axial ligand. Labels HbA, hemoglobin A; Mb, Myoglobin: sGC, soluble guanylyl cyclase; Bs, Bacillus subtilis; Ec, Escherichia coli; h, human; p, pig; Rm, Rhizobium meliloti; and sw, sperm whale. (D) Resonance Raman spectra of the CO adduct of the HDP–heme complex. Spectra of the unphotolyzed (trace a), photolyzed at 100 ns after dissociation of CO (trace b), and the reduced 5-coordinate (trace c) heme of HDP. The pump and probe pulse wavelength were set at 532 and 436 nm, respectively.

