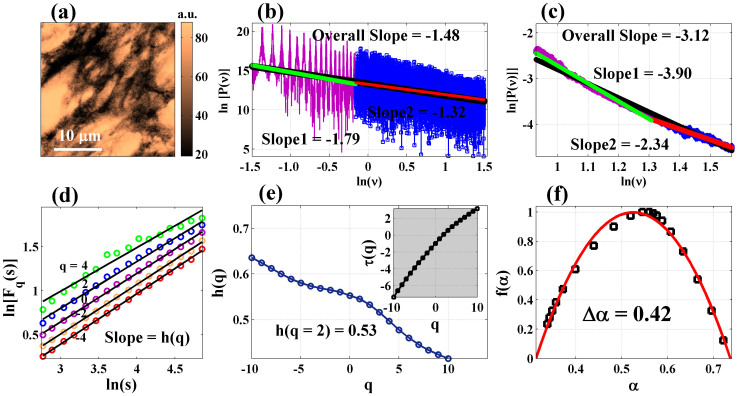
Figure 1. Evidence of multifractality in the spatial variation of tissue RI.
(a) DIC image of typical Grade I precancerous human cervix (connective tissue slice). (b) Fourier power spectrum of the generated 1D RI fluctuation series (shown in natural logarithm scale). Fitting at two selected ν-ranges (lower (green) and higher (red), respectively) and overall fitting (black) yield different values for slope (manifestation of multifractality) (c) The light scattering signal [P(ν) = I(ν) × k−4] recorded from the same tissue also yields multiple spectral slope exponents (fitting at two selected ν ranges and overall fitting on the entire ν range are shown). (d), (e), (f): Results of the MFDFA forward analysis on the detrended (by least square polynomial fitting) spatial index fluctuations (from the DIC image). (d) The variation of the moment (q) dependent fluctuation function Fq(s) with length scale s (constructed using Eq. 2). The points represent the MFDFA-derived values of Fq(s) and the lines are power law fitting. Considerable variation in the slopes of log Fq(s) vs log s with varying q confirms multifractality. (e) The variation of the generalized Hurst exponent h(q) (derived from the slopes of log Fq(s) vs log s) and the classical scaling exponent τ(q) (derived using Eq. 3) (inset). The points represent the MFDFA-derived values and the lines are guide for the eye (for these and all subsequent figures displaying these parameters). (f) The resulting singularity spectrum f(α) (derived using Eq. 4). The points represent the derived values for f(α) and the line represents the fitted data (using 2nd order polynomial) for this and all subsequent figures displaying f(α). The value for the full width of the fitted singularity spectrum, Δα (taken at f(α) = 0) is noted in the figure.

