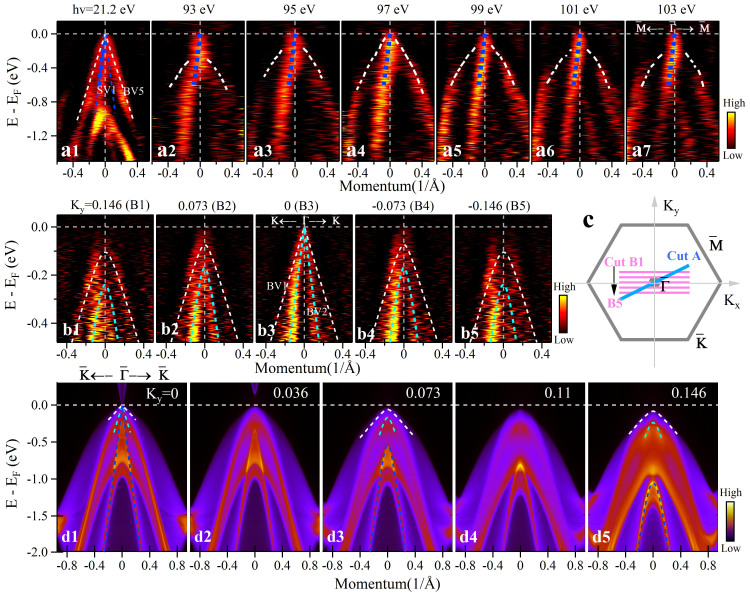
Figure 4. Band structure of Cd3As2 (112) surface measured at different Kz and its band structure evolution in the Kx-Ky plane.
(a). Band structure along Γ-M direction (cut A in (c)) measured using different photon energies at a temperature T = 45 K. Different photon energy corresponds to different Kz. The inner band highlighted with blue dashed line shows weak Kz dependence, while the outer band (marked as white dashed lines) shows an obvious change with Kz. (b). Band structure along several momentum cuts along Γ-K direction (cuts B1 to B5 in (c)) around Γ point in the Kx-Ky plane measured using 21.2 eV photon energy. The observed two sets of bands are fitted by hyperbolic function, shown as cyan dotted line for the inner band and white dahsed line for the outer band. The velocities used in the fitting functions are 1.4 eV· Å and 3.1 eV· Å for the outer band and inner band, respectively. (c). Location of the momentum cuts in the Brillouin zone. (d). Calculated band structures at different Ky in the Kx-Ky plane. Here, we use the same hyperbola functions for the calculated bands as those from fitting the measured bands in (b).

