Figure 3.
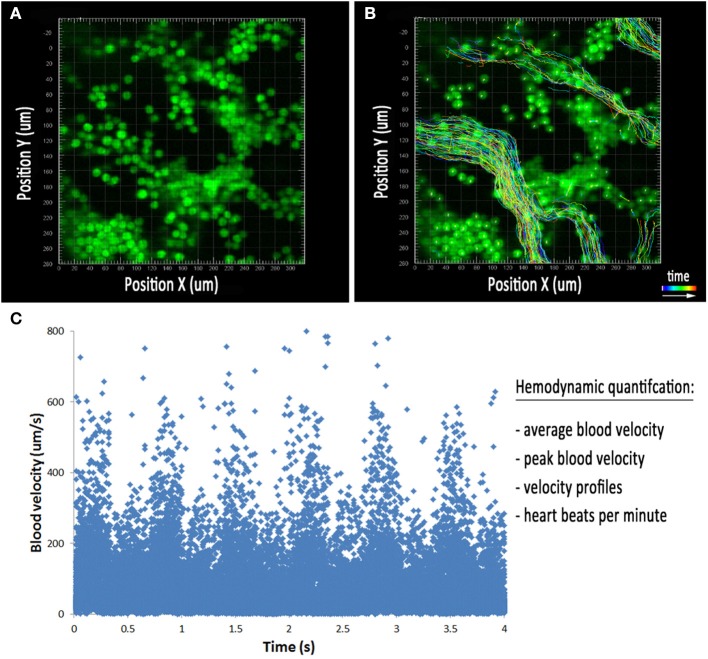
Hemodynamic analysis in the embryonic yolk sac. (A) Cultured embryos with erythrocytes labeled using the ε-globin-GFP transgene near the blood islands at E8.5. (B) Tracks of all cells detected using image processing software during the movie represented in (A). The colored lines represent the position of the blood cells over the course of the time lapse. (C) Plot of individual cell velocities over the course of the time lapse. This allows for the quantification of average blood velocity, peak blood velocity, velocity profiles, and heart rate.

