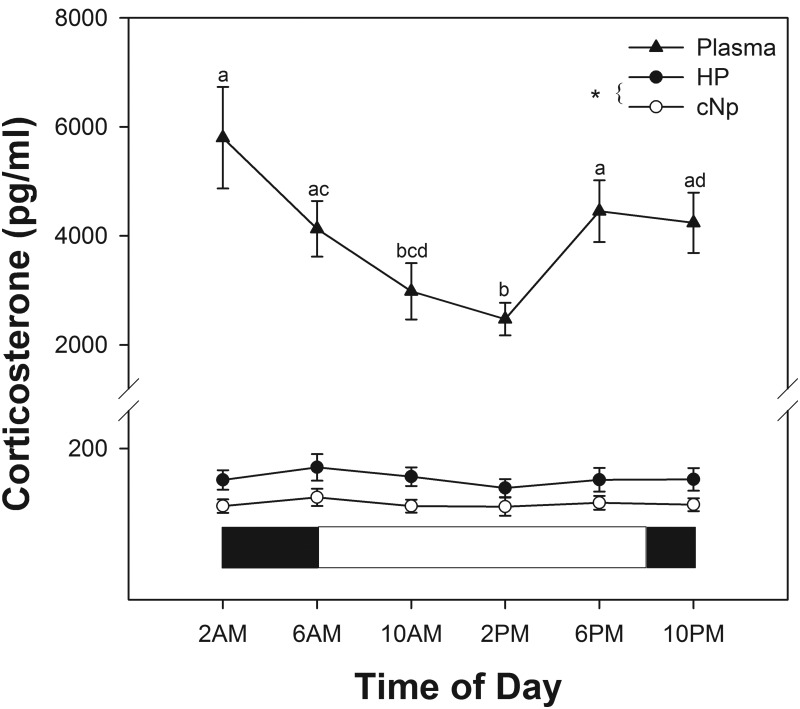
Figure 3.
Baseline brain CORT (HP and cNp; n = 8 and n = 7, respectively) and plasma CORT (n = 9 per sampling period) across the daily cycle (24 h). Brain CORT represents raw CORT levels averaged across two successive 30-minute bins. White and black bars below data indicate light and dark periods, respectively. Letters above plasma CORT symbols indicate significance (P < .05). *, A significant overall difference between HP and cNp CORT.

