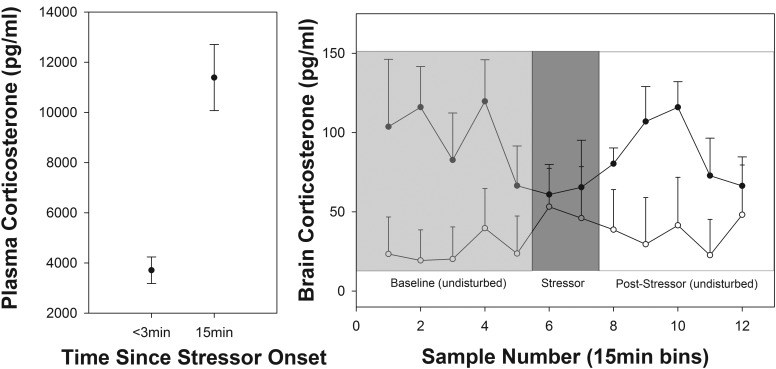
Figure 4.
Plasma and brain CORT levels in response to a standardized restraint stressor. Left panel, Plasma CORT levels at the start (baseline) and after 15 minutes of restraint. Right panel, Mean HP (dark circles; n = 8) and cNp (open circles; n = 6) CORT levels over the course of the restraint stressor. Points represent 15 minutes of sample collection. Four baseline samples were collected prior to the start of the stress series. Note that the dead volume of the tubing was approximately 18 μL and, due to an oversight, was not taken into account. However, given that each 15 minutes of collection yielded approximately 15 μL of sample, the actual time at which the stress response could be expected to be observed in the cerebrospinal fluid was adjusted to the next 15-minute sample after the actual start of blood sampling (ie, sample 6 instead of sample 5).

