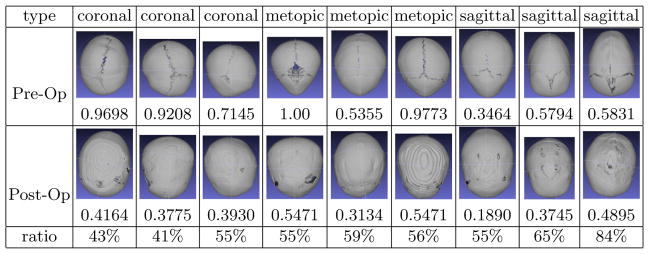
Fig. 3.

Quantification comparison of pre-operative and post-operative skulls: these images are the superior views of nine skulls (for each symptom type). Under the images are their severity scores. The upper row contains pre-operative skulls, and the bottom row are the post-operative skulls of the same subjects as the pre-op ones above it. A subject is normal if the score is ≤ 0. The larger a number is, the more abnormal it is.
