
Fig. 1.
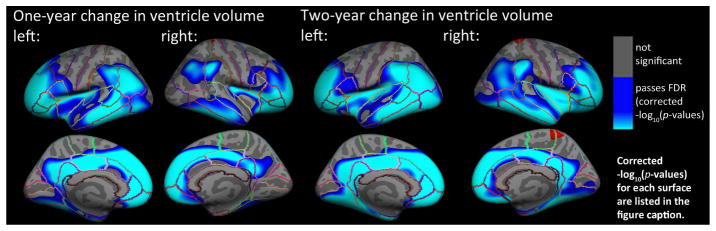
Hemispheric 3D maps show significant negative associations in the entire sample between 1-year (N=677) and 2-year (N=536) change in VV and baseline cortical GM thickness in all individuals, after controlling for age, sex, and diagnosis (AD, MCI, or healthy elderly) (1-year change, left: −log10(p-values)=1.53–3.76, right: −log10(p-values)=1.70–3.96; 2-year change, left: −log10(p-values)=1.51–3.77, right: −log10(p-values)=1.55–3.80, corrected). Results are corrected for multiple comparisons by thresholding at a q=0.05 false discovery rate (FDR) threshold across the entire brain surface. Blue represents areas where p-values passed the corrected significance threshold for a negative relationship between progressive ventricular enlargement and baseline cortical thickness values (greater VV enlargement associated with lower cortical GM thickness at baseline).