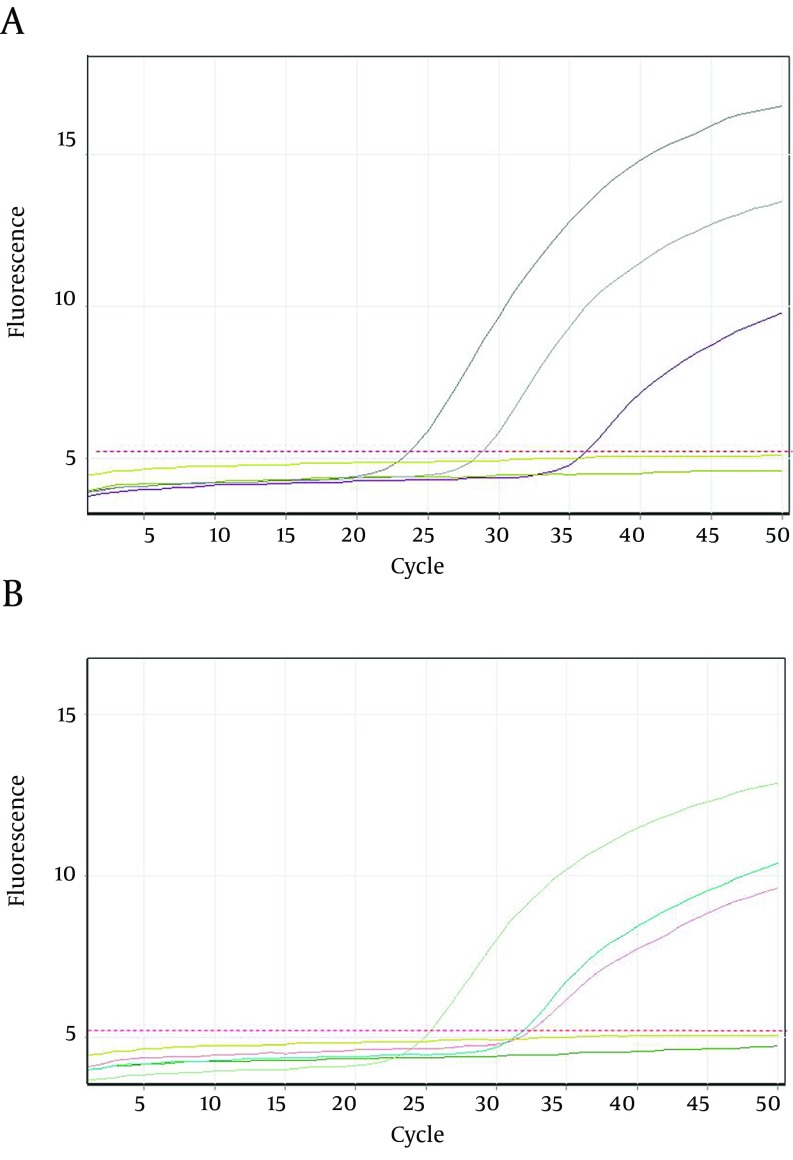
Figure 3. Amplification Plots of Lamivudine- Resistant Hepatitis B Virus Strains Using Real-Time PCR.
A. Plots were read on FAM channel. Plots represent an HBV-Y (I/V)DD mutated strain (Which is positive in FAM channel but negative in JOE channel) and two logarithmic dilutions of positive control of HBV-YMDD wild type strain (Which are positive in both FAM and JOE channels). B. Plots were read on JOE channel. The plots represent two logarithmic dilutions of positive control and one sample with YMDD wild type strain. In the both figures the plots that are under the threshold line represent negative control and samples with non-related HBV strains.

