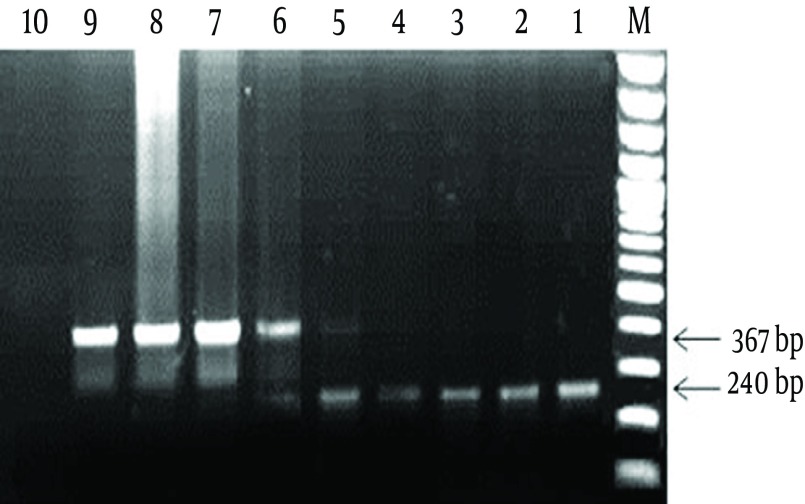
Figure 3. The Related Results to Optimization of the IPC Concentration.
M: 100 bp DNA Marker; 1: positive control for diagnostic 16SrRNA gene; 2-8: PCR products of the tubes containing 1 pg to 1 µg of pTZ57R/T-IPC plasmid in the presence of 1 ng of pTZ57R/T-16S plasmid; 9: the IPC positive control; 10: Negative control. As seen in figure, the best concentration of IPC for use in the PCR reaction was 1 ng concentration (well No. 5).

