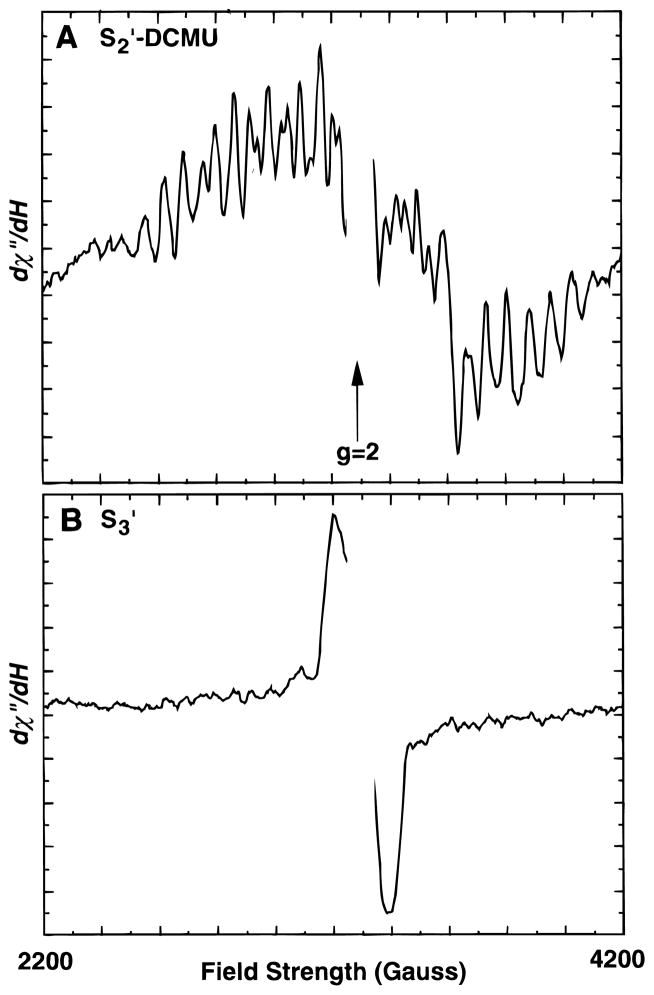
Figure 1.
EPR Spectra from Ca-depleted samples in the S2′ (A) and S3′-states (B). The S2′-state sample was a Ca-depleted sample with DCMU added. The S3′-state sample had no DCMU added. Both were advanced from the S1′ state by illumination at 273 K. The multiline spectrum in panel A is displayed on an expanded vertical scale (×4.3) to allow comparison with the higher amplitude S3′-state signal in panel B. Spectrometer conditions: microwave frequency, 9.2 GHz; microwave power, 20 mW; modulation amplitude, 20 G; temperature, 8 K.

