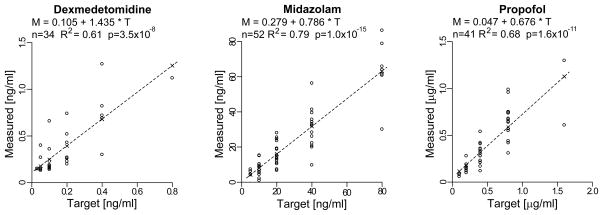
Fig. 1.
Comparison between target (x-axis) and measured (y-axis) blood concentrations for the three sedatives. A linear model (top of graphs and dashed lines) was used to determine the group-wide estimated blood concentrations (×) at each target value utilized in the saccadic analysis (CONC values). For each linear model we also report the number of available samples n, the adjusted R2, and the p value of the slope of the linear regression.

