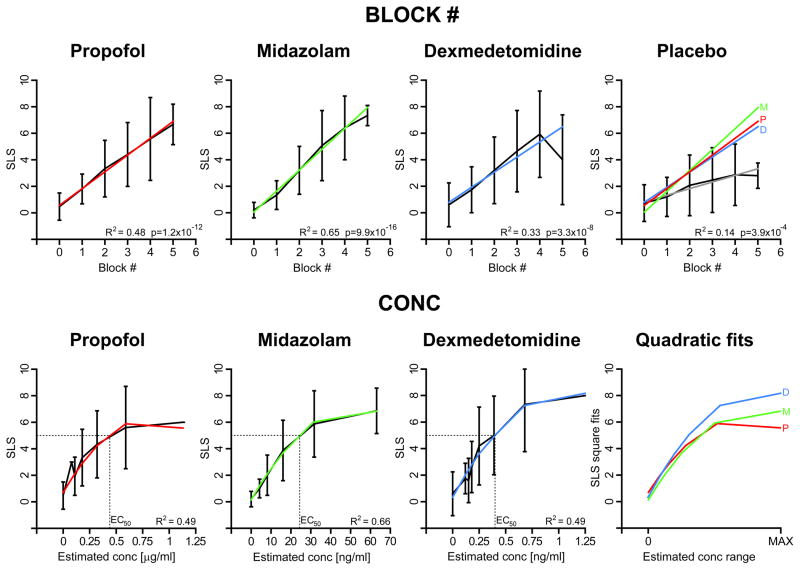
Fig. 2.
SLS analysis. Top four panels: SLS as a function of BLOCK # in each group as average and ±SD. The linear regression is reported in color with, on the bottom right corner, the R2 and p-value of the slope of the linear regression. In the “Placebo” panel, the linear regressions of the three drugs are superimposed on the placebo results for comparison. First three lower panels: SLS as a function of CONC for the three drugs, unmasking a non-linear relationship. The plots also show the associated EC50 values, defined as the estimated blood concentration of sedative where SLS has a value of 5, and the R2 of the quadratic fits. “Quadratic fits” panel: superimposition of the SLS quadratic models of the drugs with the horizontal axis magnification adjusted in such a way to have the three drug CONC ranges fitting inside the x-axis segment “0 to MAX”.

