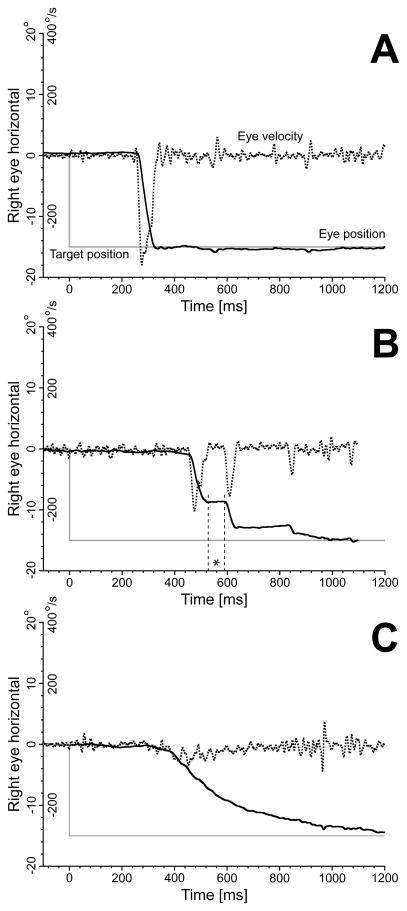
Fig. 8.
Sample 15° leftward trials from subject 029JG acquired at the highest propofol dosage for this subject (BLOCK=4; target concentration 0.80 ng/ml; estimated concentration 0.59 ng/ml). Panel A: trial similar to the subject’s placebo responses; Panel B: response broken into a sequence of smaller saccades, with an evident reduction in gain of the primary saccade. The asterisk indicates the first intrasaccadic interval, which duration was only 62 ms; Panel C: saccade with an extremely slow dynamics. Vertical axis: target position (grey traces); horizontal right eye position (continuous black traces); horizontal right eye velocity (dotted black traces). Position and velocity scales reported on the y-axis. Horizontal axis: time in ms.

