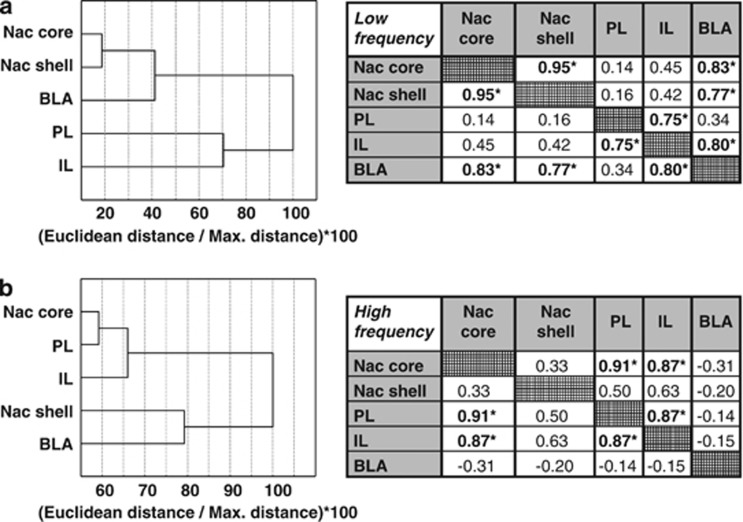
Figure 5.
Cluster analysis of the hierarchical organization between the five structures of interest in the Low and High frequency rats. (a) In Low frequency rats, cortical structures (IL and PL) and subcortical structures (NAc core, NAc shell and BLA) clustered separately and distantly. NAc core and shell showed the smallest Euclidean distance. (b) In High frequency rats the cortical/subcortical hierarchy evidenced in Low frequency rats was not observed, ie, PL and NAc core clustered close together. Correlations of c-Fos expression between structures in Low (Top table) and High frequency rats (Bottom table), respectively. Different profiles of significant correlations were observed; a strong positive correlation between PL and NAc core in the High frequency group, a strong positive correlation between BLA and NAc core in the Low frequency group (n=6 per group).

