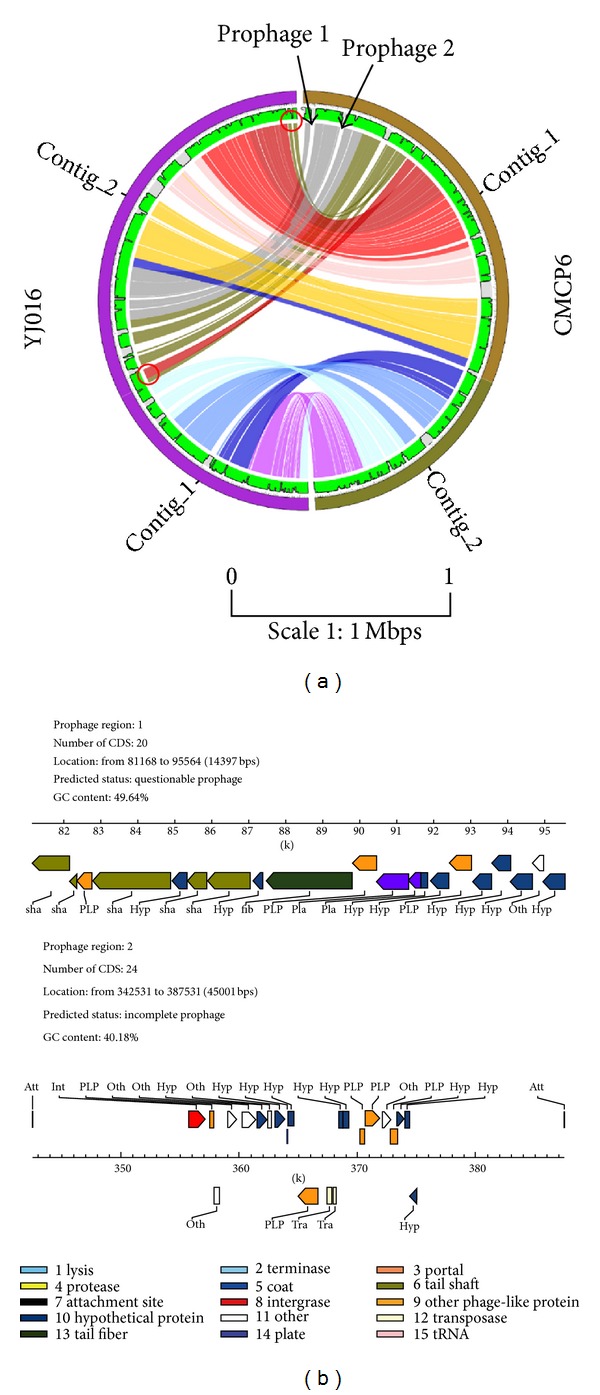
Figure 2.

Example of a pairwise genome alignment between V. vulnificus YJ016 and V. vulnificus CMCP6. (a) Circos plot reveals differences between the two genomes. Red circle indicates the translocations possibly occur. Black arrowheads indicate phage insertions. (b) The structure of the two putative prophages. (Scale of the Circos 1 : 1 Mbps).
