
Figure 1.
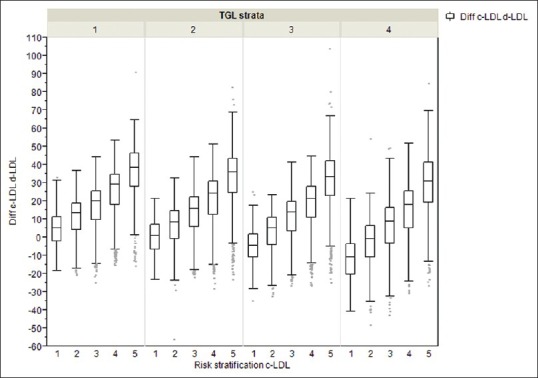
Differences between FF calculated LDL and directly measured LDL in the y-axis against the across various strata of TGΩ and LDL¶ in the x-axis expressed as box-plots (whiskers indicating 5th-95th centile). Ω = TG strata: <100 - I, 101-150 - II, 151-200 - III, 201-400 - IV, >401 -V; ¶ = LDL strata <70 - i, 70-99 - ii, 100-130 - iii, 131-160 - iv, >160 - v