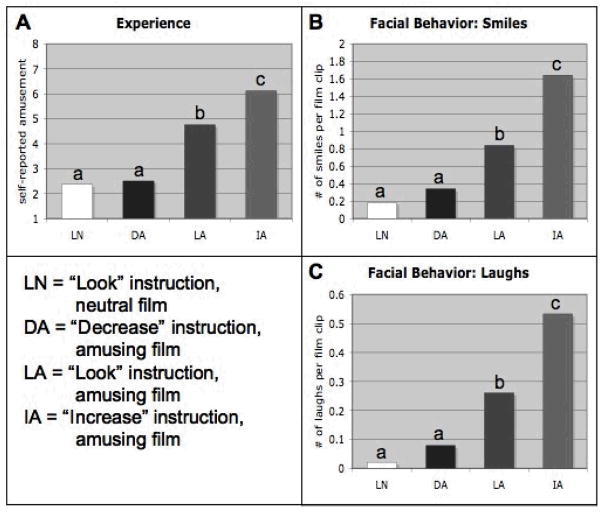
Figure 1.
Mean Self-Reported Experience and Expressive Behavior During Film Presentation
For all panels, means are for the film period; means that do not share a superscript differ at p < .05. LN = “Look” instruction, neutral film; DA = “Decrease” instruction, amusing film; LA = “Look” instruction, amusing film; IA = “Increase” instruction, amusing film. Panel A: Mean self-reported experience (Mean square error [MSE] = 1.104). Panel B: Mean smiling behavior (MSE = 0.100). Panel C: Mean laughing behavior (MSE = 0.039).

