
Figure 2.
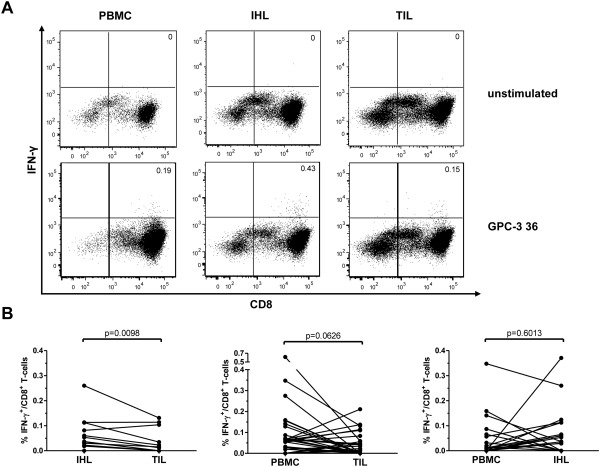
Tumor‐infiltration of TAA‐specific CD8+ T cells. CD8+ T cells were isolated from PBMC, IHL, and TIL and then evaluated as described in the legend to Fig. 1. (A) Representative dotplots showing the production of IFN‐γ in response to the peptide GPC‐3 36 in one HCC patient in PBMC, IHL, and TIL. Numbers indicate %IFN‐γ+/CD8+ T cells. The upper panels show the unstimulated control. (B) Pairwise comparison of response magnitude (%IFN‐γ+/CD8+ T cells) in the different compartments. Each dot represents one peptide‐specific CD8+ T‐cell response. Wilcoxon signed rank test was used.