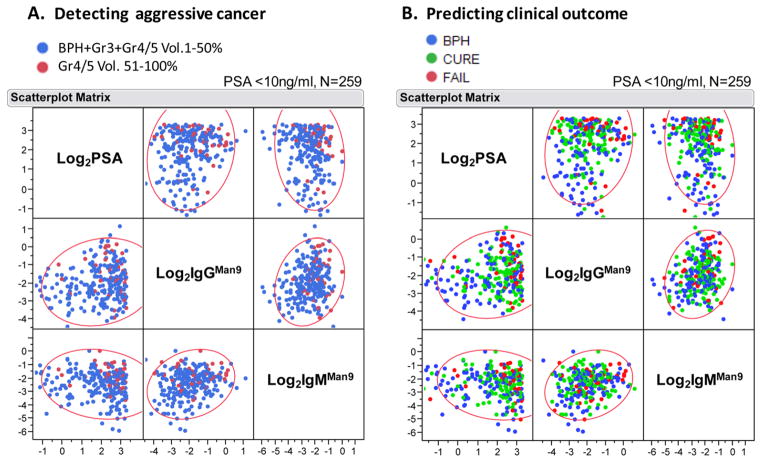
Fig. 7.
Multivariate plots of Log2PSA, Log2IgMMan9, and Log2IgGMan9 in a PSA gray zone population (n = 259). Each dot in the Scatterplot Matrix represents one subject; the color of dot classifies subject groups as marked in each graph. (A) Distribution of Gr4/5 Vol. 51–100% (colored in red) among other groups, including BPH, Gr3, or Gr4/5 Vol. 1–50% (colored in blue); (B) distribution of BPH (blue), clinical Cure (green); and clinical Failure (red) postradical prostatectomy. BPH, benign prostatic hyperplasia.

