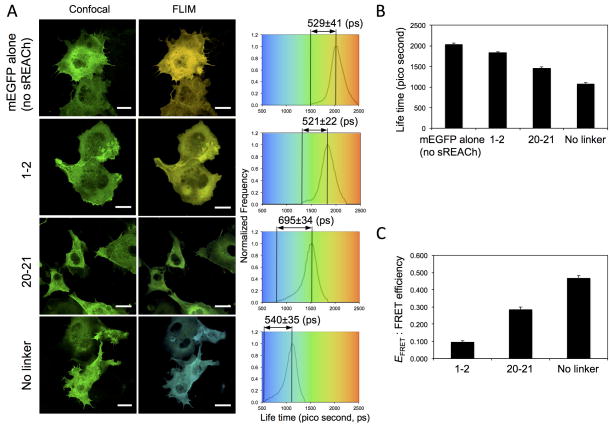
Figure 3. FLIM-FRET study of FLNA-CS expressed in live COS-7 cells.
(a) COS-7 cells were transfected with pFLAG-FLNA-CS with (repeats 1–2 or 20–21) or without linker between mEGFP and sREACh (Supplementary Fig. 4, without mCherry), or without sREACh and were used to acquire mEGFP intensity (confocal) and lifetime (FLIM) images. Bar=20 μm. The lifetime distributions are shown for representative cells expressing FLNA-CS. The results of the fluorescence lifetime analysis are summarized in panels (b) and (c). Error bars represent SD (n=3). FRET efficiency (EFRET) was calculated from EFRET = 1−τDA/τD where τ is the lifetime of the donor (mEGFP) in the presence of quencher (sREACh) and τD is the average lifetime of the donor in the absence of quencher.

