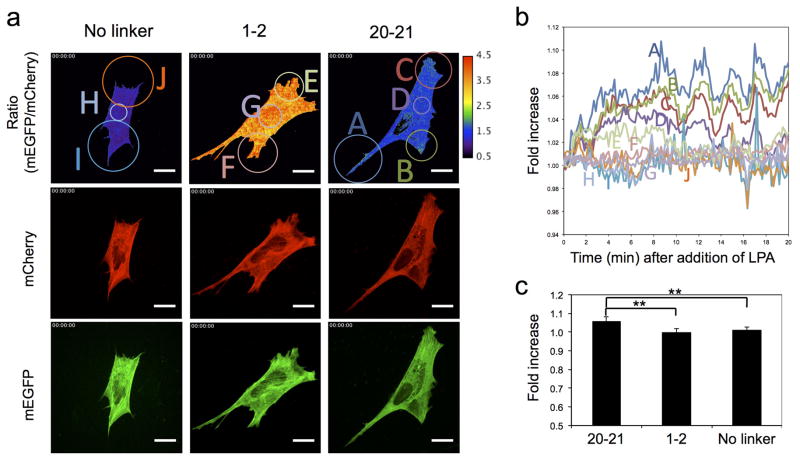
Figure 7. LPA-induced myosin contraction increases conformational changes in the FLNA-CS(20–21) probe expressed in MEF cells.
(a) Spatial conformational changes in FLNA-CSs expressed in MEF cells following LPA (1 μM) treatment. Scale bar 20 μm. The corresponding movies are shown in Supplementary movie 8. (b and c) Quantification of spatial conformational changes in the FLNA-CSs probe expressed in MEF cells stimulated with LPA. Intensities of different regions (circled in panel a) of the ratio images were quantified, normalized (relative to before stimulation), and plotted as a function of time (b). Changes of average intensities of ten independent ratio images before and after (15 min) LPA stimulation were quantitated and plotted (c). Error bars represent SD (n=10). **P<0.005 by a two-tailed t test.

