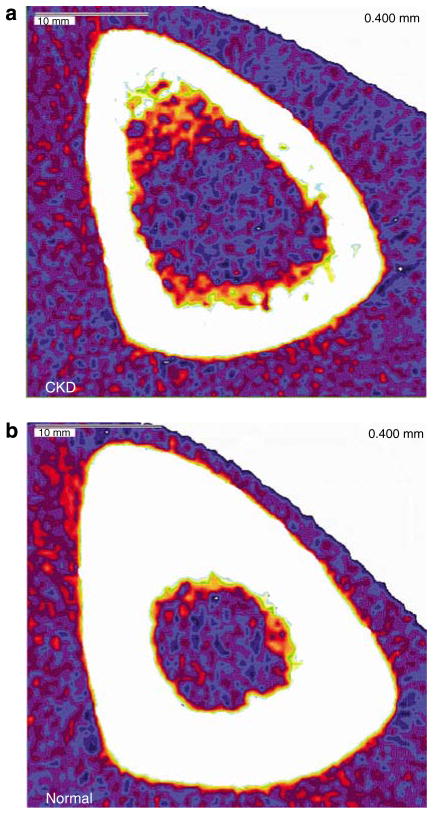
Figure 1. Example images from techniques to evaluate bone structure.
pQCT scans of the tibia mid-diaphysis in (a) 64-year-old male with CKD Stage 4, and (b) 62-year-old male with normal kidney function. In comparison with the cortex of the healthy control, the cortex of the patient with CKD is noted to have decreased cortical density and cortical thinning.

