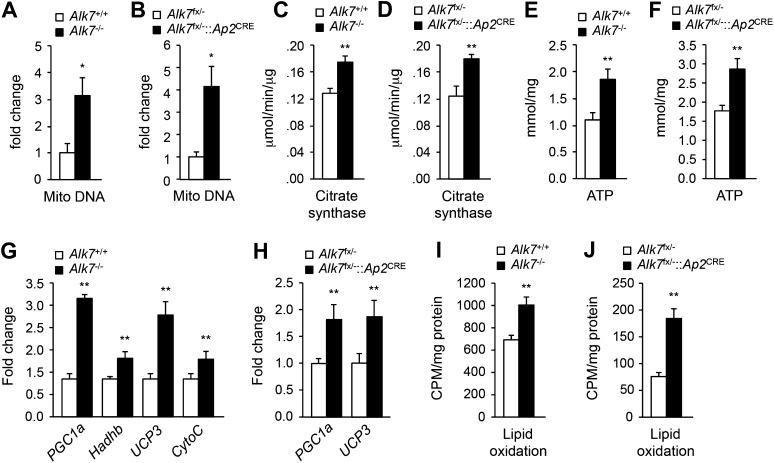
Figure 4. Elevated adipose tissue mitochondrial biogenesis and activity in fat-specific Alk7 knock-out mice on a high fat diet.
(A–F) Mitochondrial biogenesis assessed by measurements of mitochondrial (mito) DNA content (A and B), citrate synthase activity (C and D), and ATP content (E and F) in epididymal adipose tissue of global Alk7−/− (A, C, E) and fat-specific Alk7fx/−::Ap2CRE (B, D, F) knock-out mice after 16 weeks on a high fat diet (HFD). N = 8 mice per group in all cases. (G and H) Relative mRNA expression of markers of mitochondrial biogenesis and function PGC1a, Hadhb, UCP3, and cytochrome C assessed by quantitative PCR (Q-PCR) in epididymal adipose tissue of global Alk7−/− (G) and fat-specific Alk7fx/−::Ap2CRE (H) knock-out mice after 16 weeks on HFD. N = 6 mice per group in all cases. (I and J) Lipid oxidation in epididymal adipose tissue of global Alk7−/− (I) and fat-specific Alk7fx/−::Ap2CRE (J) knock-out mice. N = 3 mice per group in all cases. *p < 0.05; **p < 0.01; NS, non-significant (mutant vs control). All error bars show mean ± SEM.

