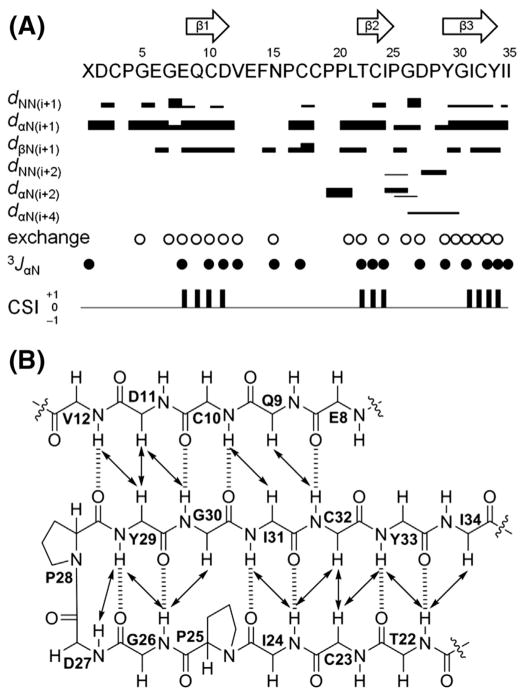
Fig. 2.
Secondary structure elements of ASPC. (A) Summary of sequential and medium range NOE correlations (|i°–°j| < 5), hydrogen–deuterium exchange experiments, 3JNH-Hα (3JαN) values, and chemical shift indices (CSI). NOE intensities are grouped into 4 classes (2.5, 3.0, 4.0, and 5.0 Å) and are represented by the thicknesses of solid lines. Thicker lines indicate stronger NOE correlations. Open circles indicate the amide protons observed in 1H and TOCSY spectra recorded in CD3OD (500 MHz). Solid circles indicate the positions where 3JNH-Hα values are larger than 8 Hz. Consensus results of CSI derived from CαH, Cα, and Cβ chemical shifts of ASPC are indicated by a ternary index with values of −1, 0 and +1. The arrows at the top of the figure indicate the positions of β-sheets as determined by a combination of strong sequential dαN, weak dNN, non-exchanged amide protons, large 3JNH-Hα values, and a CSI value of +1. (B) Long-range NOE correlations (|i°–°j| ≥ 5) and H-bonds of the triple-stranded antiparallel β sheet region in ASPC. NOE correlations and H-bonds are indicated by solid arrows and dashed lines, respectively.

