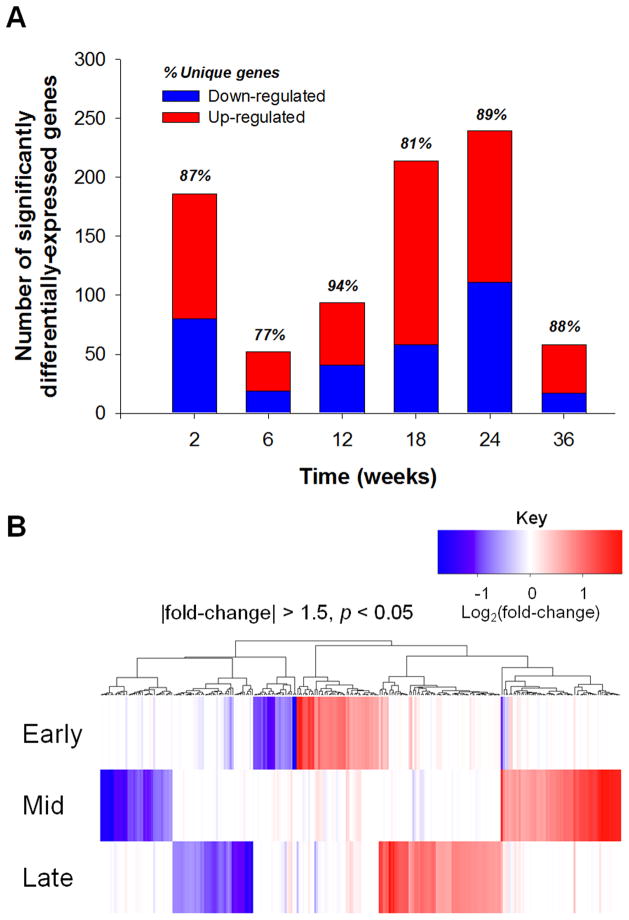
Figure 2.
(A) Number of genes significantly differentially-regulated throughout duration of chronic exposure to asymptomatic domoic acid compared to time-matched vehicle controls. The proportion of up- and down-regulated genes is shown by red and blue bars, respectively. Percentage of genes unique to each time point is listed above each bar. (B) Heatmap depicting clustered gene transcription responses (±1.5-fold, p<0.05, 265 probes) to chronic domoic acid exposure across exposure duration; Early = 2 and 6 week time points, Mid = 12 and 18 week time points, Late = 24 and 36 week time points.

