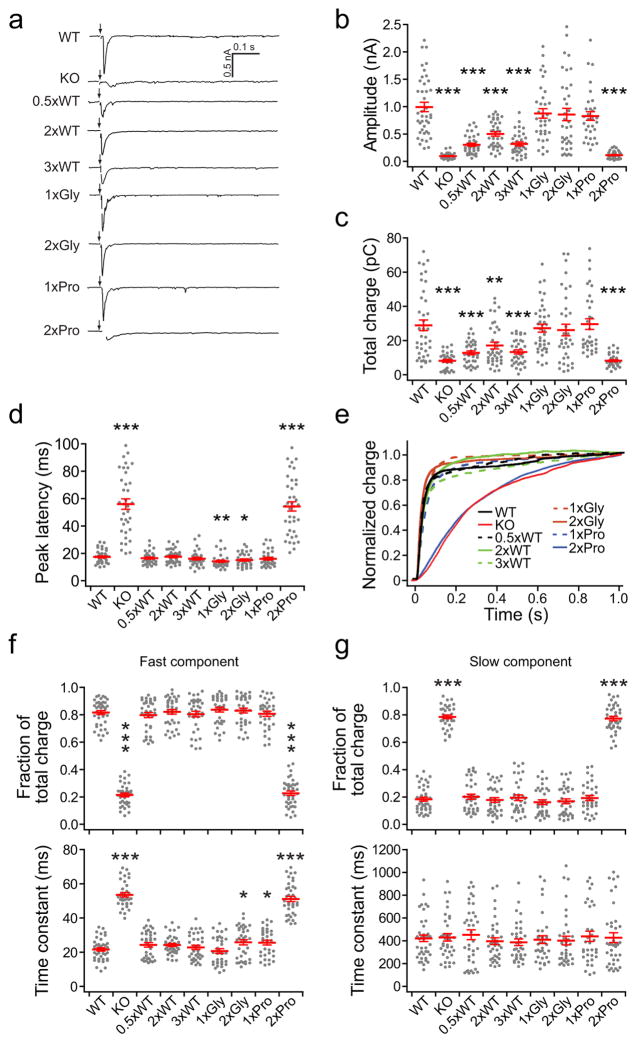
Figure 2.
The linker mutants exhibit marked differences in their abilities to support evoked transmission. (a) Representative eEPSC traces recorded from WT, syt KO and KO neurons that expressed each linker mutant. (b–d) Scatter plots of eEPSC amplitude (b), total charge (c), and latency to peak (d; the time between the start of stimulation and the peak current). (e) Normalized cumulative total charge transfer, averaged for each group. (f, g) Fraction of total release (upper panels), and release time constants (lower panels) for the fast (f) and slow release components (g), which were calculated by fitting the normalized cumulative charge traces in panel e with a double exponential function. For each condition, we recorded from 33–41 cells from a total of six coverslips, where two coverslips were obtained from each of three independent litters of mice. The mean values ± SEM are indicated. Results from bootstrap statistical analysis are listed in Supplementary Statistics. Asterisks indicate differences compared with WT; * p < 0.05, ** p < 0.01, *** p < 0.001.

