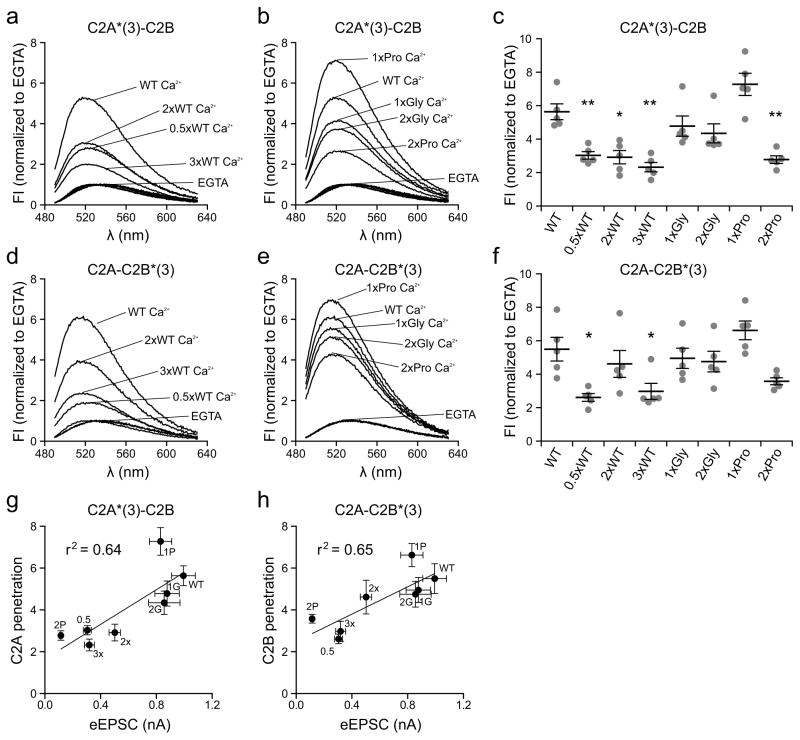
Figure 4.
Correlation between the membrane penetration activity of syt linker mutants with their abilities to trigger rapid SV release. (a–f) Linker mutations affect the membrane penetration activity of syt. The tip of Ca2+ and membrane-binding loop 3, in the C2A or C2B domain of the cytoplasmic domain of syt, was labeled with NBD; these constructs are denoted as C2A*(3)-C2B or C2A-C2B*(3), respectively. The fluorescence of NBD exhibited an increase in intensity and a blue shift in its emission spectra upon Ca2+-triggered penetration of loop 3 into lipid bilayers harboring 15% PS. (a, b) Representative normalized NBD fluorescence spectra of C2A*(3)-C2B obtained in 0.2 mM EGTA or 1 mM Ca2+. (c) Scatter plot of peak values of the normalized NBD fluorescence spectra of C2A*(3)-C2B in 1 mM Ca2+. (d, e) Representative normalized NBD fluorescence spectra of C2A-C2B*(3) obtained in 0.2 mM EGTA or 1 mM Ca2+. (f) Scatter plot of peak values of the normalized NBD fluorescence spectra of C2A-C2B*(3) in 1 mM Ca2+. N = 5 independent experiments. (g, h) A clear correlation was observed between the membrane penetration activity of C2A (g), and C2B (h), and eEPSC amplitude (Fig. 2b). The mean values ± SEM are indicated. Statistical significance was determined using a bootstrap approach. Asterisks indicate differences compared with WT; * p < 0.05, ** p < 0.01. All statistical analysis and results, including the equations and p-values for the linear regressions, are provided in Supplementary Statistics.

