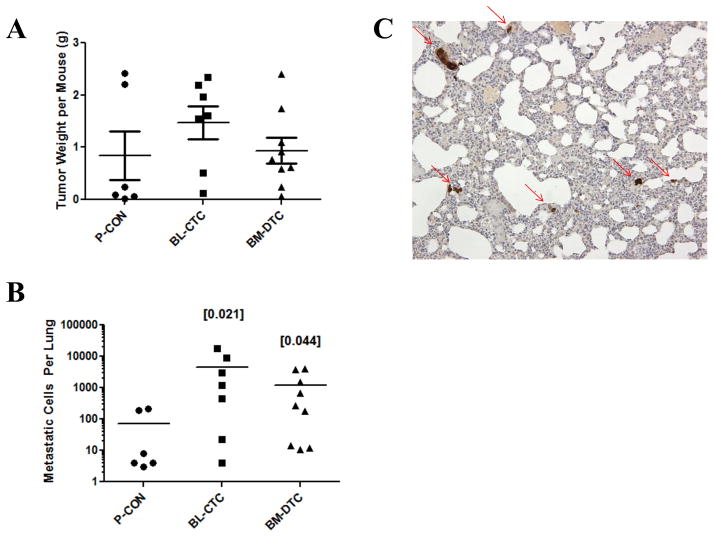
Figure 3. CTCs and DTCs Exhibit Increased Metastatic Potential.
P-CON, BL-CTC, or BM-DTC cells were implanted into the prostate gland, and five weeks later primary tumor weight (A) and metastasis to the lungs (B) were measured. Individual values for each mouse are denoted by individual symbols, with the central line denoting mean value, and whiskers (only for weight) denoting ±SE. Values in brackets denote Fisher’s Exact Test p-values, as compared to P-CON. C) A representative 10x image of a CTC lung with metastatic cells highlighted with an arrow. This image was obtained from a mouse with approximately 1300 total metastatic cells.

