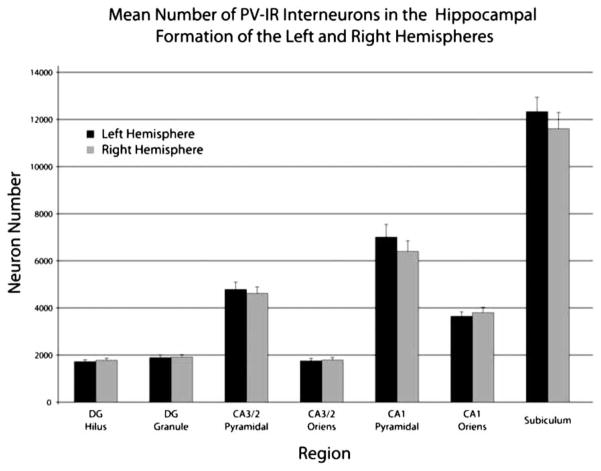
Figure 5.
Graph depicting the mean number of PV-IR interneurons estimated for left and right hippocampal formations by region and layer. Each bar represents the average number of PV-IR interneurons in the specified layer and includes data from both control and prenatally malnourished rats; error bars are equal to the SEM.

