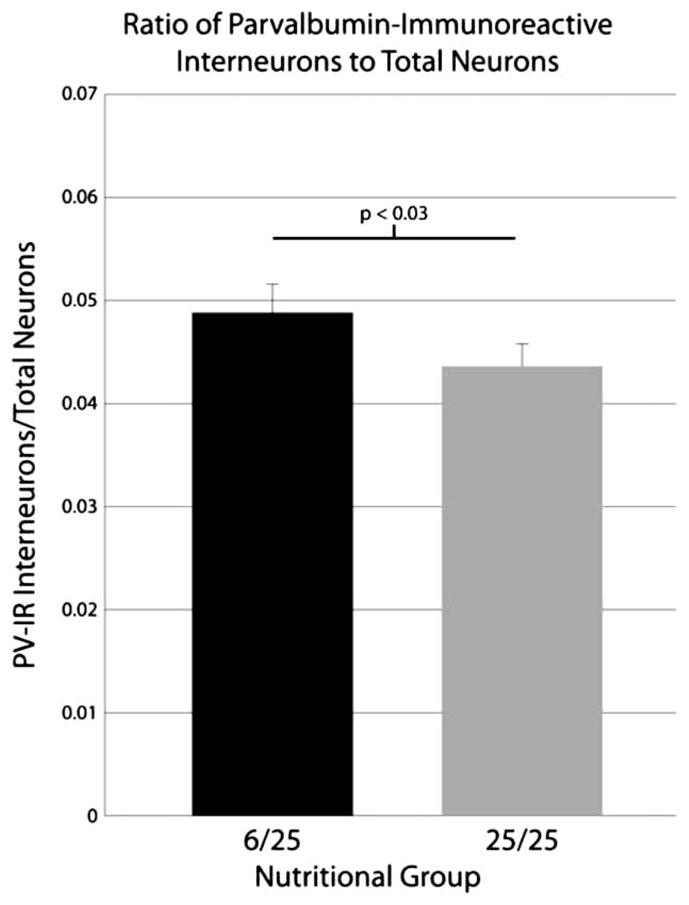
Figure 7.

Graph depicting the ratios of PV-IR interneurons to total neurons in the prenatally malnourished and control rats. There is a significant increase of 11.9% in this ratio for the prenatally malnourished animals. Data are collapsed across subfields due to the lack of a significant effect for the region factor; error bars are equal to the SEM. Total neuron data used in constructing ratios are taken from a prior study1 as noted in the text.
