Figure 3.
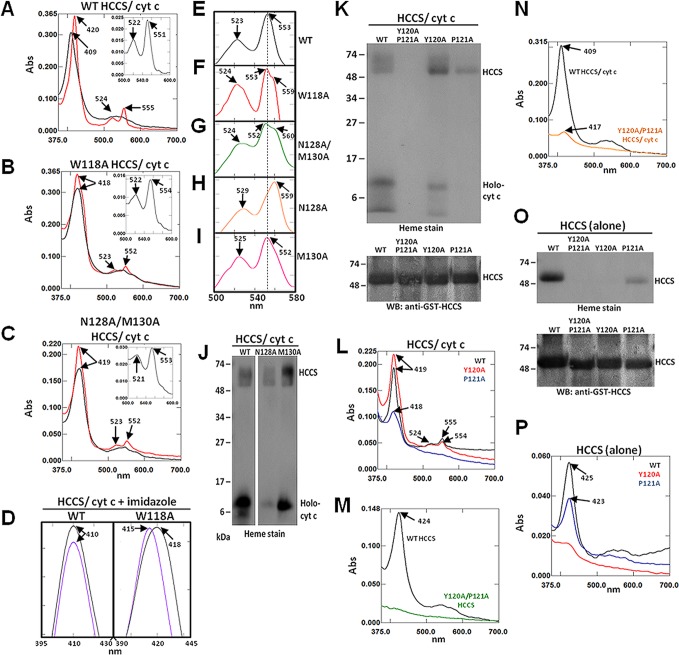
Mutation of HCCS Domain I residues alter heme interactions. Recombinant GST-HCCS protein (alone) and GST-HCCS: cytochrome c cocomplexes were purified from Δccm E. coli and prepared for UV/vis absorption spectroscopy and SDS-PAGE. Shown are spectra for (A) WT HCCS/cyt c, (B) W118A HCCS/cyt c, and (C) N128A/M130A HCCS/cyt c following purification (black line), chemical reduction with sodium dithionite (red), and extraction with pyridine (inset). (D) Soret peak spectra were obtained from cocomplexes representing WT HCCS/cyt c (left) and W118A HCCS/cyt c (right) following purification (black) and treatment with 100 mM imidazole (purple). UV/vis spectra between 500–580 nm (alpha/beta region) of cocomplexes treated with 100 mM imidazole following chemical reduction with sodium dithionite are shown for (E) WT HCCS/cyt c, (F) W118A HCCS/cyt c, (G) N128A/M130A HCCS/cyt c, (H) N128A HCCS/cyt c, and (I) M130A HCCS/cyt c. (J) Heme stain of the indicated purified cocomplexes following SDS-PAGE and transfer to nitrocellulose. (K) Heme stain (top) and GST-HCCS immunoblot (bottom) of the indicated purified cocomplexes following SDS-PAGE and transfer to nitrocellulose. (L) UV–vis spectra of sodium dithionite reduced purified cocomplexes from WT HCCS (black), Y120A HCCS (red), and P121A HCCS (blue). (M) UV–vis spectra of HCCS proteins (alone) purified from WT HCCS (black) and Y120A/P121A HCCS (green). (N) UV–vis spectra of purified cocomplexes from WT HCCS/cyt c (black) and Y120A/P121A HCCS/cyt c (orange). (O) Heme stain (top) and GST-HCCS immunoblot (bottom) of the indicated purified cocomplexes following SDS-PAGE and transfer to nitrocellulose. (P) UV–vis spectra of HCCS proteins (alone) purified from WT HCCS (black), Y120A HCCS (red), and P121A HCCS (blue). Arrows indicate wavelength (nm) of peak absorption maxima. All spectra were performed with equal amounts (50–100 μg) of total purified protein. All SDS-PAGE samples were equally loaded (2–5 μg of total purified protein each). For all proteins, Bradford quantitation was confirmed by Coomassie staining, which also indicated that GST-HCCS proteins were obtained at >90% purity.

